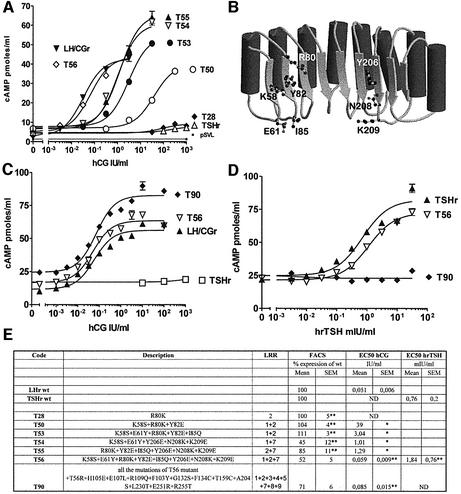
Fig. 3. Transformation of TSHr into LH/CGr. Concentration–action curves for TSHr mutants under stimulation by increasing concentrations of hCG or hrTSH. COS-7 cells transiently transfected with the various constructs were stimulated by increasing concentrations of hCG or hrTSH and intracellular cAMP values were determined (see Materials and methods). Each curve is representative of at least two separate experiments. The levels of cAMP observed for the various constructs in the absence of stimulation by a hormone reflect their constitutive activity and their different level of expression. (A) The effects of the eight residues found to be sensitive to hCG (see text and B) are additive: T28 has one residue, T50 three, T53 and T54 five, T55 six and T56 eight residues mutated (see E for details). (B) Schematic representation of the LRR portion of TSHr with the eight residues giving a gain of function towards hCG highlighted. (C and D) T56 is as sensitive to hCG as the wt LH/CGr and nearly as sensitive to hrTSH as the wt TSHr. T90 (with the same eight mutated residues as T56, plus 12 others, see E) is as sensitive to hCG as the wt LH/CGr, but does not respond to hrTSH. (E) Short table summarizing the data shown in the figure. Column 1, code name of the mutants; column 2, full description of the mutants, with numbering as in Figure 2; column 3, indication of the LRR β-strand bearing the mutations; column 4, amount of mutant receptors present at the surface of transfected COS cells (as percentage of wild type, see Materials and methods); column 5, EC50 values in IU/ml for stimulation by hCG of mutant TSHr sensitive enough to obtain a plateau; column 6, EC50 values in mIU/ml for stimulation by hrTSH of mutant TSHr sensitive enough to obtain a plateau. *A single measurement was performed; **two measurements were performed (result expressed as mean ± range of duplicates). ND, EC50 not determined because concentration–action curve does not reach a plateau of maximal stimulation.

An official website of the United States government
Here's how you know
Official websites use .gov
A
.gov website belongs to an official
government organization in the United States.
Secure .gov websites use HTTPS
A lock (
) or https:// means you've safely
connected to the .gov website. Share sensitive
information only on official, secure websites.
