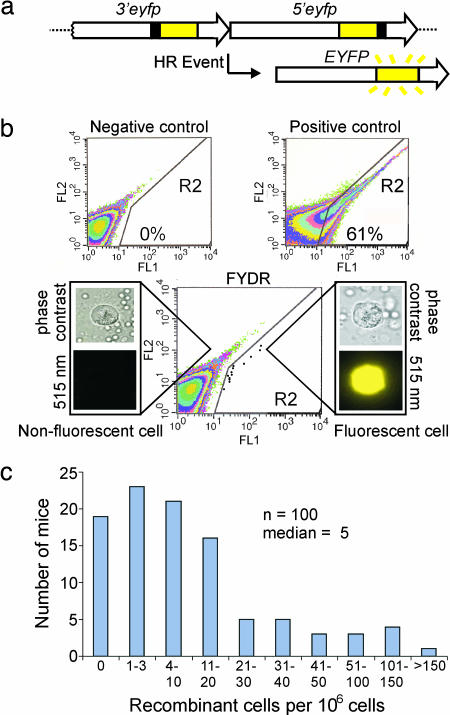
Fig. 1.
FYDR system and analysis of pancreatic cells by flow cytometry. (a) Arrangement of the FYDR recombination substrate. Large arrows indicate expression cassettes; yellow boxes show coding sequences; black boxes show positions of deleted sequences (deletion sizes not to scale). For a more complete description of HR mechanisms that can restore full-length EYFP coding sequences, see Jonnalagadda et al. (39). (b) Flow cytometry results of disaggregated pancreatic cells. Axes indicate relative fluorescence intensity at 515–545 nm (FL1) vs. 562–588 nm (FL2). R2 region delineates EYFP-positive cells. Representative data are shown for a negative control mouse, a positive control FYDR-recombined mouse, and an FYDR mouse. For clarity, data for individual cells (dots) have been darkened in the FYDR R2 region. Percentages of fluorescent cells identified in the R2 region are indicated for the positive and negative controls. Cell images are representative of disaggregated pancreatic cells from an FYDR mouse taken at ×40 with phase contrast or an EYFP filter (515 nm). Image of a fluorescent cell under an EYFP filter is colorized. (c) Spontaneous frequency of recombinant pancreatic cells per 106 as determined by flow cytometry for 100 4- to 10-week-old FYDR mice. n = number of independent samples.

