Fig. 2.
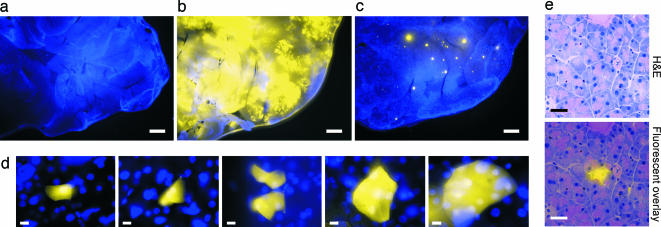
Analysis of fluorescent foci in mouse pancreata. For analysis of freshly excised tissue, images show overlays of EYFP- (510–560 nm) and UV- (420 nm) filtered images. Nuclei are stained with Hoechst 33342. (a–c) Portions of negative control (a), positive control (b), and FYDR (c) mouse pancreata imaged at ×1. (Scale bar, 1 mm.) Brightness and contrast for UV-filtered images were adjusted equivalently. For EYFP images, brightness and contrast for negative control and FYDR (5-s exposure) images were adjusted equivalently. To avoid overexposure of the positive control, a shorter exposure time was used (1 s) and brightness and contrast were not adjusted. (d) Images of fluorescent recombinant cells in freshly excised tissue at ×40. (Scale bar, 10 μm.) Brightness and contrast were optimized for each image. (e) Histological images were collected at ×40. (Scale bar, 30 μm.) (Upper) H&E-stained section. (Lower) Overlay of H&E and fluorescence imaged under an EYFP filter (515 nm). Brightness and contrast of fluorescence were optimized. EYFP fluorescence is colorized.

