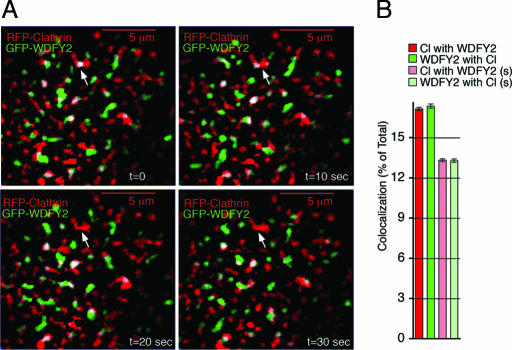
Fig. 8.
Simultaneous imaging of GFP-WDFY2 and RFP-clathrin. (A) Cos-7 cells cotransfected with GFP-WDFY2 (green) and RFP-clathrin (red) were imaged by TIRF-M. Shown are four time points taken 10 s apart. The arrow indicates a clathrin-coated membrane region colocalizing with WDFY2 in the first time point. Clathrin persists in the region in the four time points shown, but WDFY2 does not. (B) Colocalization is expressed as the percent of total WDFY2 colocalizing with clathrin and clathrin colocalizing with WDFY2. Spurious colocalization was calculated by flipping one image along the x axis and calculating the colocalization as above. Bars and vertical lines represent the mean and standard error values for real (red and green) or spurious (light red and light green) colocalization measured in 1,500 frames from five cells imaged at 0.5 frames per s (300 frames per cell, 10 min total imaging time). Although small, the difference between real and spurious colocalization was statistically significant (P < 0.001, paired two-tailed Student’s t test).

