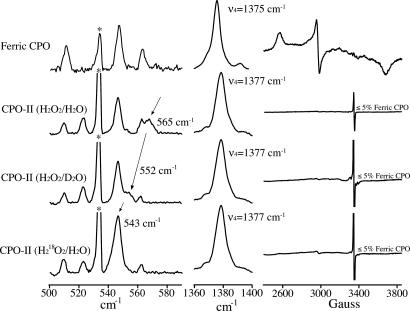
Fig. 1.
Low-frequency resonance Raman data (454.5-nm excitation), oxidation-state marker band (ν4), and EPR spectra of ferric CPO and CPO-II samples (pH 6.5). EPR spectra indicate that CPO-II samples contained <5% ferric enzyme. The radical signal near g = 2 is attributed to oxidized ascorbate (24). Arrows highlight movement of the Fe(IV)–OH stretch with isotopic substitution. ∗, labels the 466-nm line of the argon-ion laser. No movement of the oxidation-state marker band (ν4) was observed during data collection. EPR measurements taken after sample irradiation revealed no detectable change in sample composition.

