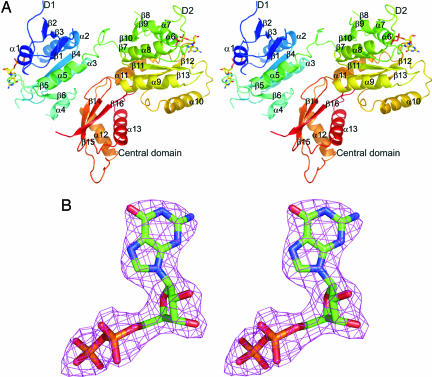
Fig. 1.
The crystal structure of the YphC/GDP complex and representative electron density. (A) A stereo diagram showing the structure of the YphC/GDP complex with each element of secondary structure labeled and the D1, D2 and central domains identified. The bound GDP molecules are shown in stick format. (B) A stereo diagram showing the final 2Fo − Fc map, contoured at 1 σ, surrounding the GDP cofactor in the second GTPase domain of YphC.

