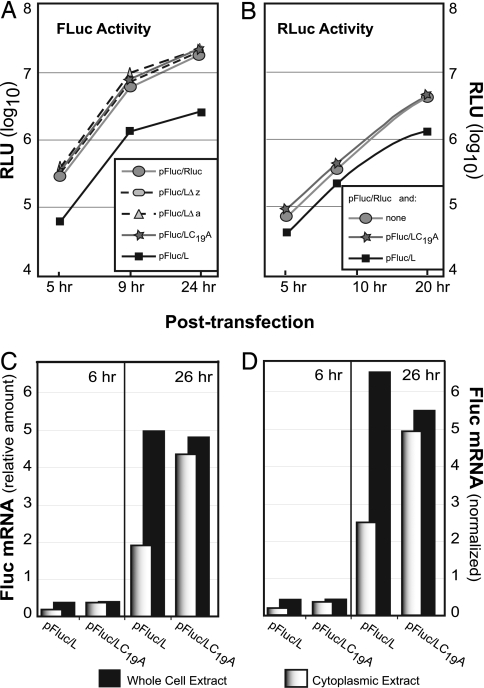
Fig. 2.
Luciferase expression in the presence of Leader. (A) Plasmid cDNAs were transfected into HeLa cells, and Fluc activity [relative light units (RLU)] was assayed at the indicated times. Values are averages for duplicate samples (<10 RLU variance). (B) Plasmid pFluc/Rluc (1 μg per plate) was augmented with pFluc/L (1 μg per plate) or pFluc/L(C19A) (1 μg per plate) and then cotransfected into HeLa cells. Rluc activity (RLU) was assayed at the indicated times. The values are averages for duplicate samples (<10 RLU variance). (C) RNA from transfected cells prepared as in A were isolated from whole cells or cytoplasmic extracts. The relative Fluc RNA titers were assessed by quantitative PCR by using a standard curve derived for this sequence. (D) The β-actin mRNA titers were determined in parallel to C. The Fluc titers (from C) were normalized to the β-actin mRNA content observed at 6 h or 26 h in the pFluc/L(C19A) noninhibitory samples. This plot controls for changes in mRNA content from 6 to 26 h due to cell growth rather than transcription.

