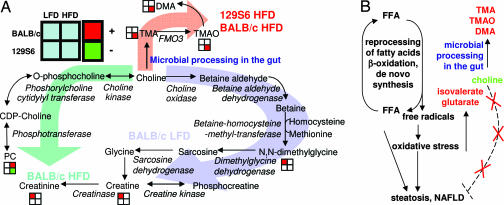
Fig. 3.
The symbiotic methylamines’ metabolic pathway (A) and their putative mechanism of liver toxicity (B). The OPLS-derived correlation is represented by standard color-coding for each metabolite: red square, positive correlation; green square, negative correlation, meaning a higher (lower) metabolite concentration in the corresponding group. FFA, free fatty acids.

