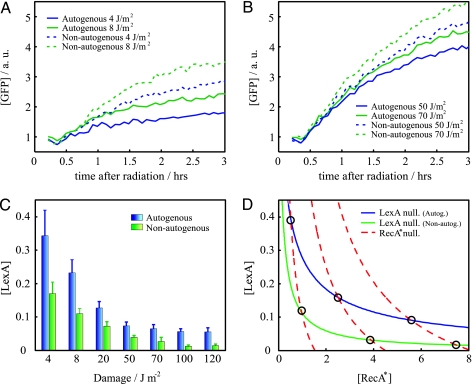
Fig. 3.
SOS response to a wide range of inducing signal. (A and B) SOS dynamics (GFP fluorescence) after UV irradiation in cells with (solid line) or without (dashed line) autogenous regulation in a regime of low (A) or high (B) damage. Overresponse is stronger at low-UV dose. Reproducibility error of experiments performed on different days is ≈10%. (C) Minimal LexA (repressor) concentration as a function of UV dose for the autogenously (blue) and nonautogenously (green) controlled circuits. (D) [LexA]–[RecA*] (activated RecA) phase space. Circles denote equilibrium states. The more proportional response of the autogenous system corresponds to a more gradual decrease of the LexA nullcline as activated RecA increases. Overresponse of the nonautogenous system is here reflected in the distribution of equilibrium states close to minimal [LexA] values. Parameters are as follows: αau = 6, k = 0.2 (see Materials and Methods), k' = k (36), β = 1.5 (36), δx = 1, δy = 1, δxy = 8, and χ = 0.17, 0.5, 0.9 (corresponding to increasing RecA* nullclines). Protein concentrations are in units of uninduced LexA equilibrium.

