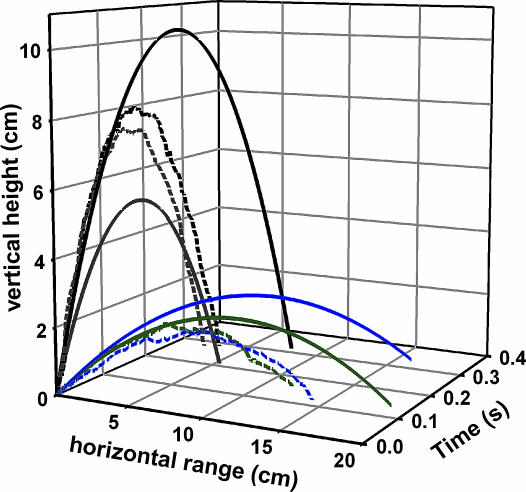
Fig. 4.
The predicted and observed trajectories of bouncer defense and escape jumps. Dashed lines represent actual digitized trajectories of four typical jumps. Solid lines depict “drag-free” trajectories based on the initial conditions of the jumps. Escape jumps (gray and black lines) yielded greater heights and, on average, double the airborne duration observed in bouncer defense jumps (blue and green lines). On average, the ranges of bouncer defense jumps were seven times greater than escape jumps. Digitized data were sampled at intervals of 17 ms from the high-speed video sequences, which were filmed at 3,000 frames per second (see Movies 3–5).

