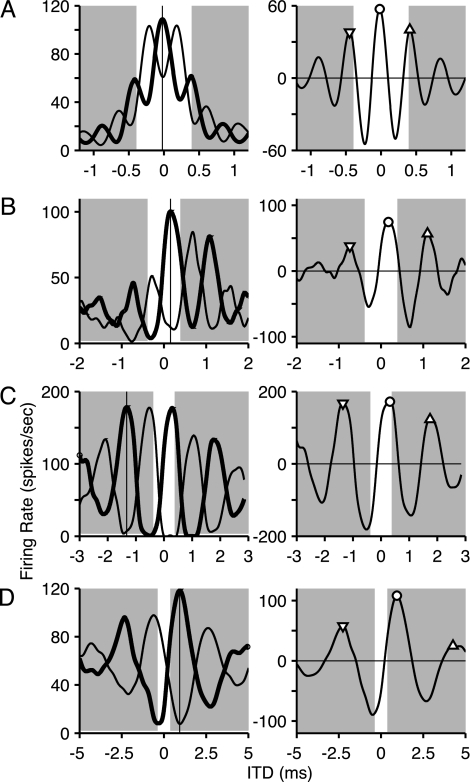
Fig. 1.
Determination of peak delays. Each row shows responses for one IC neuron, arranged from high (A) to low (D) CF. (Left) Noise-delay functions to correlated (thick line) and anticorrelated (thin line) broadband noise. These functions show the average firing rate as a function of the ITD between the stimuli to the two ears. The vertical line indicates the BD for the response to correlated noise. (Right) Difcor functions, obtained by subtracting the responses to anticorrelated noise from the responses to correlated noise of Left. Symbols indicate peak delays at the primary peak (BD, ○) and secondary (▿ and ▵) peaks, respectively. Shading indicates ITDs outside of the physiological range of cats. CFs and BDs of difcors were as follows: (A) 2410 Hz, −20 μs; (B) 1200 Hz, 180 μs; (C) 610 Hz, 320 μs; (D) 342 Hz, 940 μs. The curves are cubic splines through the original data points.

