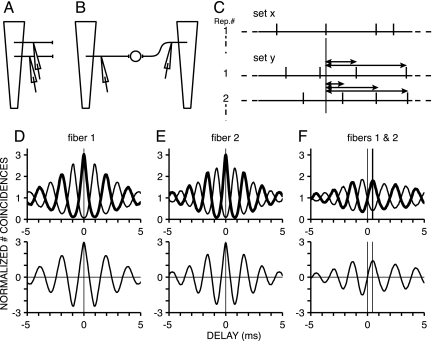
Fig. 3.
Measurement of peak delays for pairs of auditory nerve fibers. (A) Consecutive recordings from fibers of different cochlear position. Trapezoidal shape represents uncoiled basilar membrane. (B) Pairs of fibers are treated as if derived from two different sides. Counting of spike coincidences between responses from such a pair predicts the output of a simple binaural coincidence detector, which would receive inputs with a disparity in cochlear location. (C) Construction of correlograms from spiketrains to multiple stimulus repetitions (Rep. #) under two conditions, x and y. The delays at which coincidences are obtained between spikes in these conditions are tallied in a histogram. (D and E) Auto-correlogram (Upper) and difcor (Lower) for a fiber with CF of 522 Hz (D) and 617 Hz (E). Here, coincidences are computed for delays between spiketrains of a single fiber: Conditions x and y refer to responses of the same fiber. (F) Cross-correlogram and difcor for the pair of fibers of D and E: Conditions x and y here refer to responses of different fibers. Difcors are obtained by subtracting the correlogram to anticorrelated noise (thin lines in D–F Upper) from the correlogram to correlated noise (thick lines in D–F Upper).

