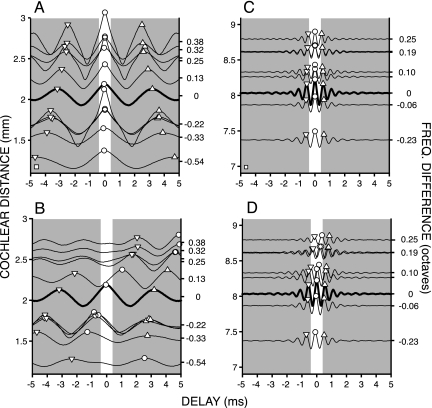
Fig. 4.
Shift in cross-correlation patterns because of cochlear disparity. (A and C) Difcors from auto-correlograms of 11 fibers with DF between 215 and 405 Hz (A) and 8 fibers with CF between 1,533 and 2,134 Hz (C). Heavy lines indicate reference fibers with DFs of 313 Hz (A) and 1,792 Hz (C). (B and D) Auto-correlograms of the reference fibers (thick line) and cross-correlograms between these reference fibers and the other fibers of A and C. All difcors are positioned according to cochlear distance from the apex (left ordinate), calculated from each fiber’s DF. The right ordinate indicates the frequency difference in octaves relative to the reference fiber. Symbols indicate primary and secondary peaks as in Fig. 1. Shading indicates delays outside of the physiological range for the cat. Height of calibration boxes in lower left corner of A and C equals a normalized number of coincidences of 1 (compare Fig. 3F Lower) and also applies to B and D. CFs for fibers in A and B were (top to bottom in Hz): 405, 391, 376, 371, 342, 313 (reference), 269 (3 fibers), 249, and 215. CFs for fibers in C and D were (top to bottom in Hz): 2,134, 2,051, 2,046, 1,919, 1,890, 1,792 (reference), 1,723, and 1,533.

