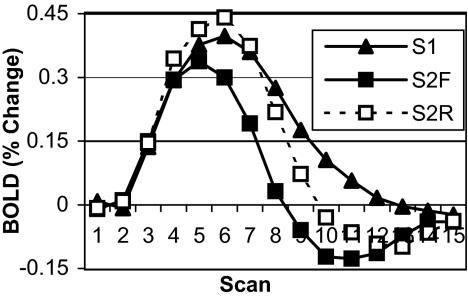
Fig. 4.
Experiment 2 BOLD data for predefined ACC ROI. Data are plotted as percent change from baseline (mean of scans 1 and 2) over the course of a single trial (15 scans, 18 sec) by imaging session and condition (S1, imaging session 1; S2F, imaging session 2 forward rules; S2R, imaging session 2 reverse rules).

