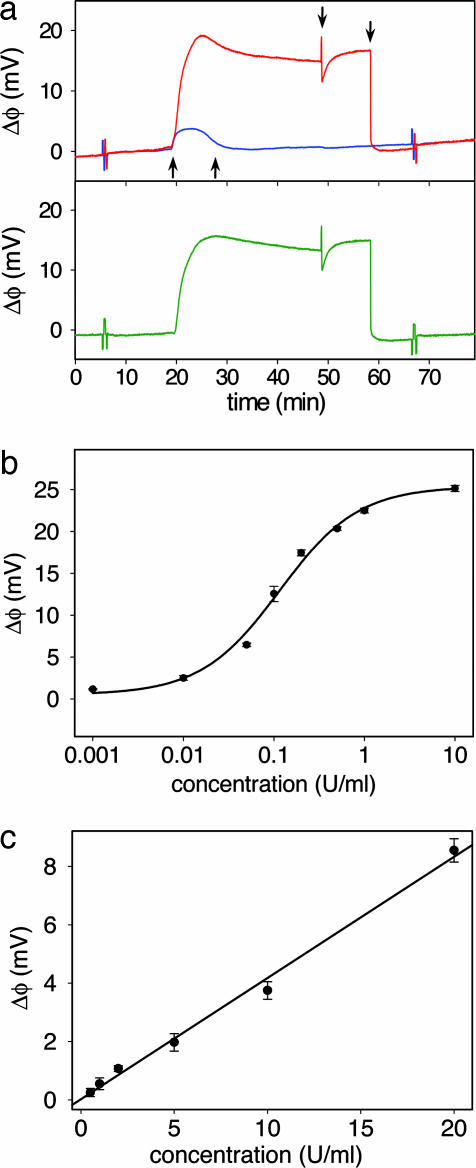
Fig. 2.
Protamine-based sensing of total heparin concentration. (a) The response to 0.3 units/ml of heparin solution in 10% PBS of the active sensor (red) and the control sensor (blue). The differential response (green) reveals the surface potential change caused by heparin binding by eliminating bulk solution effects. The arrows from left to right correspond to the injection of heparin solution, rinse with running buffer, injection of protamine solution, and the second buffer rinse. The spikes at 6 and 67 min correspond to externally applied positive and negative 2.5-mV calibration signal. (b) Dose–response curve for heparin in 10% PBS from a protamine functionalized sensor. (c) Clinically relevant range of the dose–response curves from the protamine sensor for heparin in 10% human serum. Each data point is an average of two measurements ± 1 SD.

