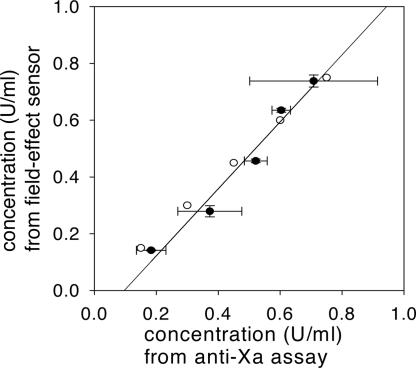
Fig. 6.
Linear correlation (r2 = 0.97) between the values for different heparin concentrations in 10% PBS obtained by field-effect measurements and the colorimetric anti-Xa assay (●). The values were obtained by using a five-point standard curve in the range of 0.1 to 0.9 units/ml. The actual values (○) were 0.1, 0.3, 0.45, 0.6, and 0.75 units/ml. The samples were diluted 10 times in the case of field-effect measurements. The horizontal error bars represent the SD from three distinct anti-Xa assays and the vertical error bars represent the SD from two field-effect measurements.

