Fig. 5.
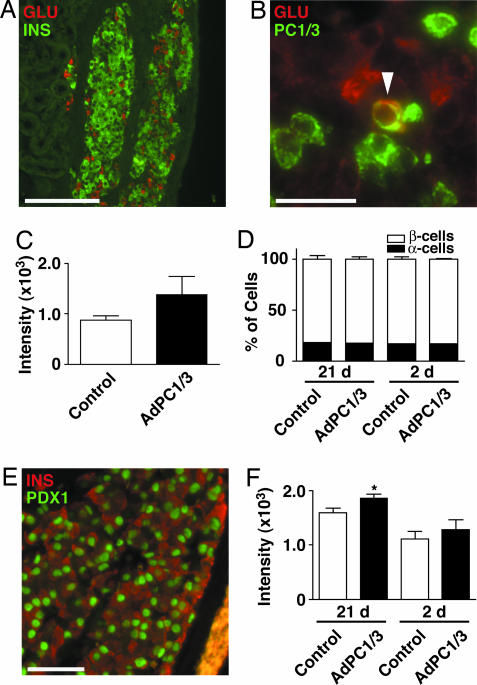
Analysis of AdPC1/3-transduced islet grafts after nephrectomy. Islet grafts were removed 2 or 21 d after transplantation and sectioned for analysis. (A) Representative graft costained for glucagon (red) and insulin (green). (B) Glucagon (red) and PC1/3 (green) staining in a representative graft retrieved 2 d after transplantation. (C) Quantification of the intensity of insulin staining in islet grafts (21 d after transplantation). Data are presented as mean fluorescence intensity; n ≥ 3. (D) Proportion of α and β cells in islet grafts costained for insulin and glucagon, expressed as the percentage of total cells counted; n ≥ 3. (E) Representative islet graft costained for insulin (red) and Pdx1 (green). (Scale bars: A, 190 μm; B and E, 50 μm.) (F) Quantification of the intensity of nuclear Pdx1 staining in islet grafts. Data are reported as mean fluorescence intensity and were analyzed by a one-tailed t test with n = 3. ∗, P < 0.05.

