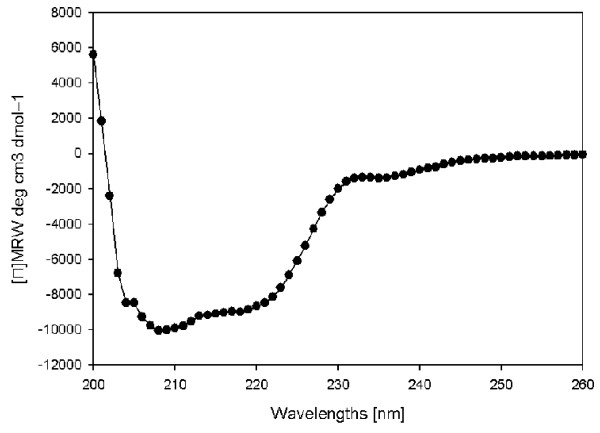
Figure 12.
Far UV CD spectrum of YfhQ protein. Spectra were measured in 0.15 M Tris-HCl pH7.5 buffer and corrected by substraction of a buffer spectrum. The concentration of YfhQ protein was 6.6 μM. Three accumulations were measured, which were recorded in millidegrees every 1 nm. The mean residue ellipticities for the spectra were calculated to aid in secondary structure determination by comparison with standard spectra for secondary structure elements.

