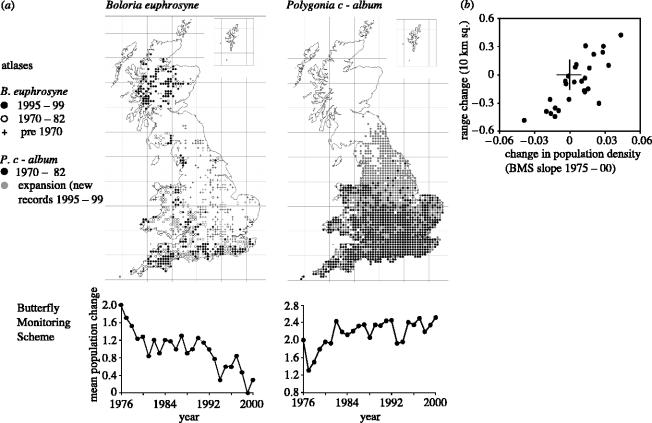
Figure 1.
Monitoring change in the distribution and abundance of British butterflies. (a) Maps comparing results from the 1970–1982 (Heath et al. 1984) and 1995–1999 (Asher et al. 2001) distributions of Boloria euphrosyne, which showed the sixth (10-percentile) greatest loss of 10 km squares for a species and Polygonia c-album which experienced the fourth (7-percentile) greatest increase between surveys. Time series of mean population size of each species on sites monitored over the same period by the BMS are shown below. (b) The correlation between 20 year trends in the population indexes of the 27 butterfly species most reliably monitored by the BMS and changes in their ranges expressed as the difference in total occupancy of 10 km squares by each species between the two mapping surveys (from Warren et al. 2001).

