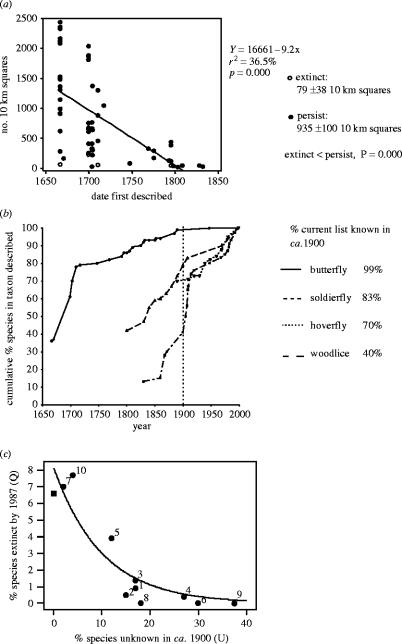
Figure 10.
Completeness of recording and of apparent extinction rates in UK invertebrates. (a) Dates of discovery of UK butterfly species (from Ford 1945; Emmett & Heath 1990; R. L. H. Dennis, personal communication) compared with range size measured as total occupancy of different 10 km squares since discovery. One cryptic species that was overlooked until the 1880s is omitted. (b) Accumulation curves of the proportion of the current species-lists of four invertebrate groups in Britain that were discovered between the seventeenth and twenty-first centuries (from Ford 1945; Emmett & Heath 1990; Thomas & Morris 1995; Stubbs & Drake 2001; Stubbs & Falk 2002; A. E. Stubbs, personal communication). (c) Percentage (Q) of insect (+spider) groups considered to have become extinct in ca 1900–1987 in relation to the percentage (U) of native species in current British lists that were unknown in ca 1900. Least squares fitted line: Q=8.13×10−0.0996U, r2=0.92, p<0.001. (Filled square) butterflies; (filled circle) other groups: (1) other Macrolepidoptera, (2) spider, (3) weevil, (4) hoverfly, (5) macro-Brachyra, (6) ant, (7) dragonfly, (8) grasshopper–cricket, (9) mosquito, (10) bumblebee (from Thomas & Clarke 2004).

