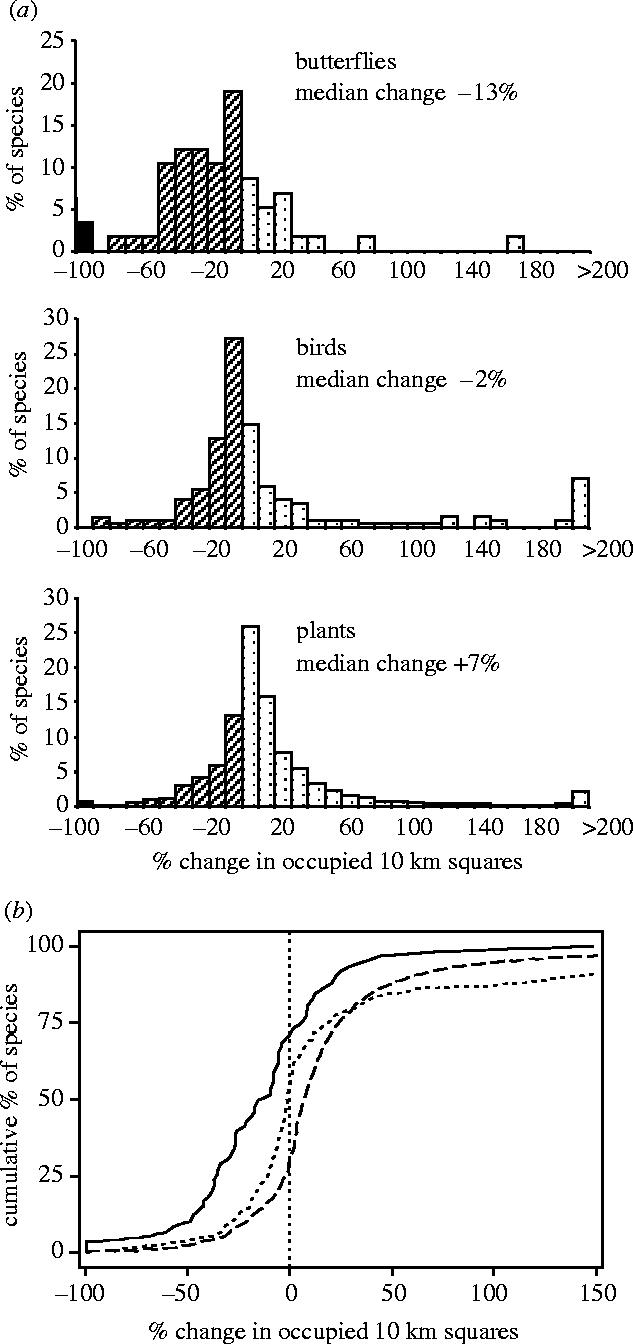
Figure 2.

Changes in the number of 10 km squares in Britain occupied by native butterfly, bird and plant species between the two censuses of each taxon (from Thomas et al. 2004). (a) Frequency distributions: black=extinct species, hatched=declining species, dots=increasing species. Median butterfly species<median bird species (p<0.001)<median plant native species (p<0.001). (b) Cumulative frequency distributions: solid line, butterflies; dotted line, birds; dashed line, plants. Butterfly declines>bird declines>plant declines (p<0.001).
