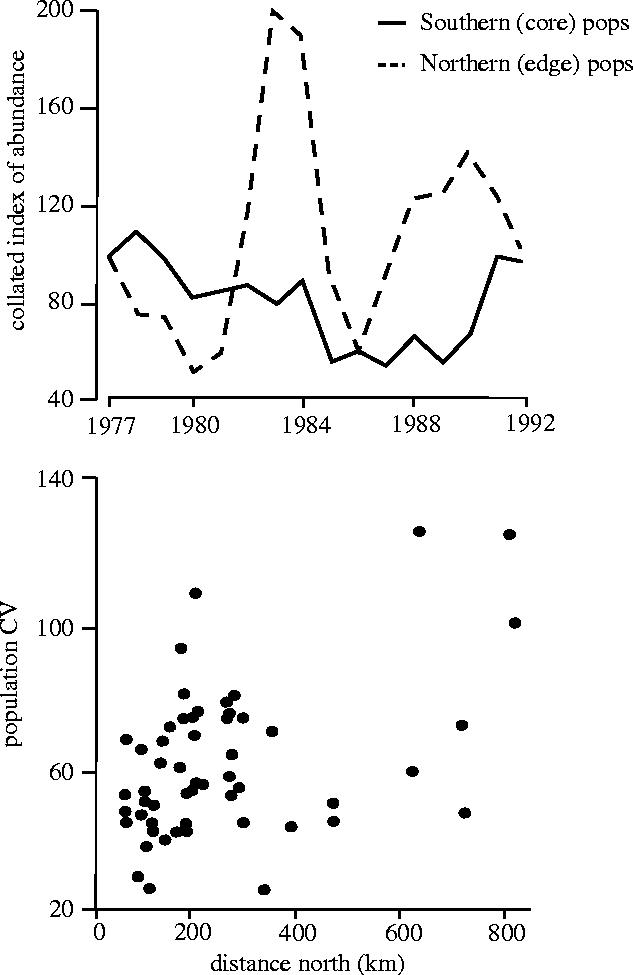
Figure 5.

Fluctuations in the size of monitored populations of butterflies at different points in their ranges. (a) The five most northern (edge of range) sites of Maniola jurtina compared with the five most southerly (core) populations. (b) CVs of all monitored populations of M. jurtina plotted against latitude (from Thomas et al. 1994) .
