
Figure 3.
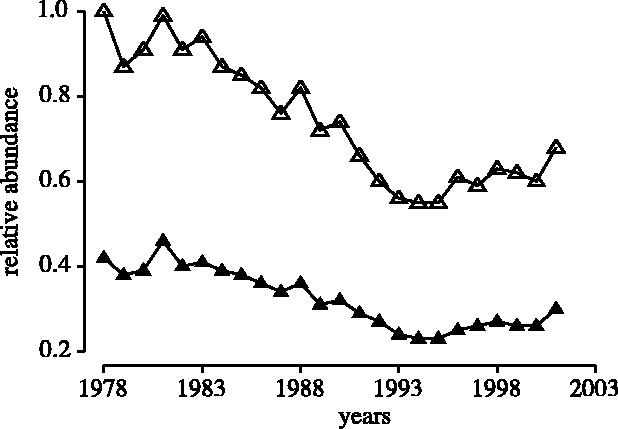
Temporal changes in the abundance of all marine fish (N=87 populations) from four regions in north-temperate oceans from 1978 through 2001. The abundance estimates for each population have been either standardized to a value of one for 1978 (open triangle) or divided by the highest estimate ever recorded for that population prior to 2002 (filled triangle).