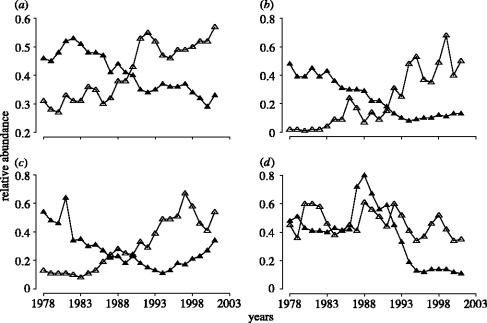
Figure 5.
Temporal changes in the abundance of pelagic (open triangle) and demersal (filled triangle) marine fish from four regions in north-temperate oceans from 1978 through 2001. The abundance estimates for each population have been divided by the highest estimate ever recorded for that population prior to 2002. Number of populations represented in each time-series is as follows: (a) Northeast Atlantic (demersal: N=27; pelagic: N=14); (b) Northwest Atlantic (demersal: N=23; pelagic: N=2); (c) North mid-Atlantic (demersal: N=13; pelagic: N=2); (d) Northeast Pacific (demersal: N=1; pelagic: N=5).

