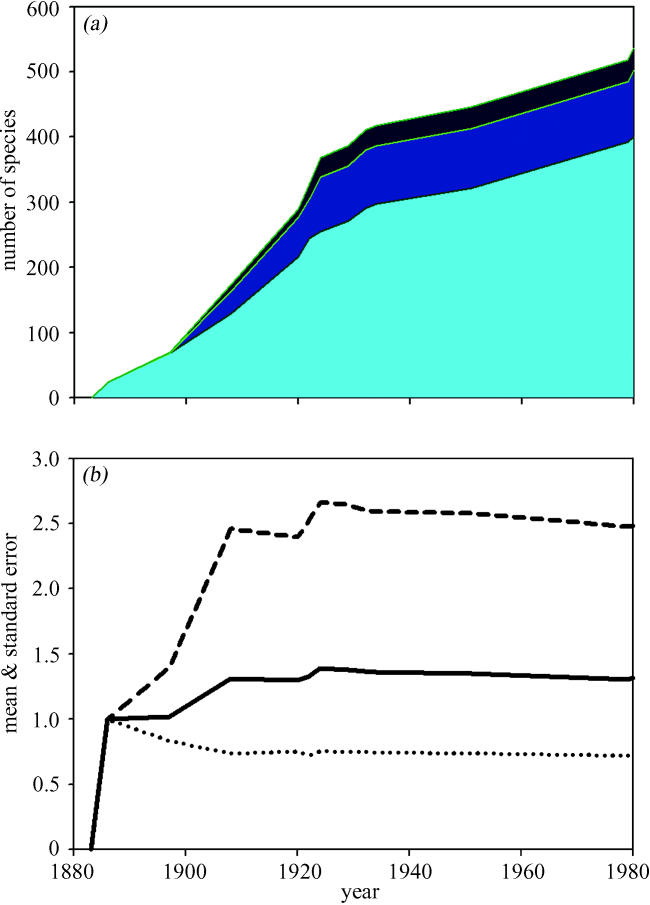
Figure 3.

(a) Trophic diversity on Krakatau, the palest blue shading represents the number of plant species, the medium blue are the number of primary consumers, and the darkest shading is the number of secondary consumers or carnivores. Data collated from surveys reported in Thornton (1996); (b) the solid line represents mean trophic level for all the species recorded in each published survey on Krakatau. The upper dashed line illustrates mean trophic level plus two standard deviations, the lower dotted line illustrates mean trophic level minus one standard deviation.
