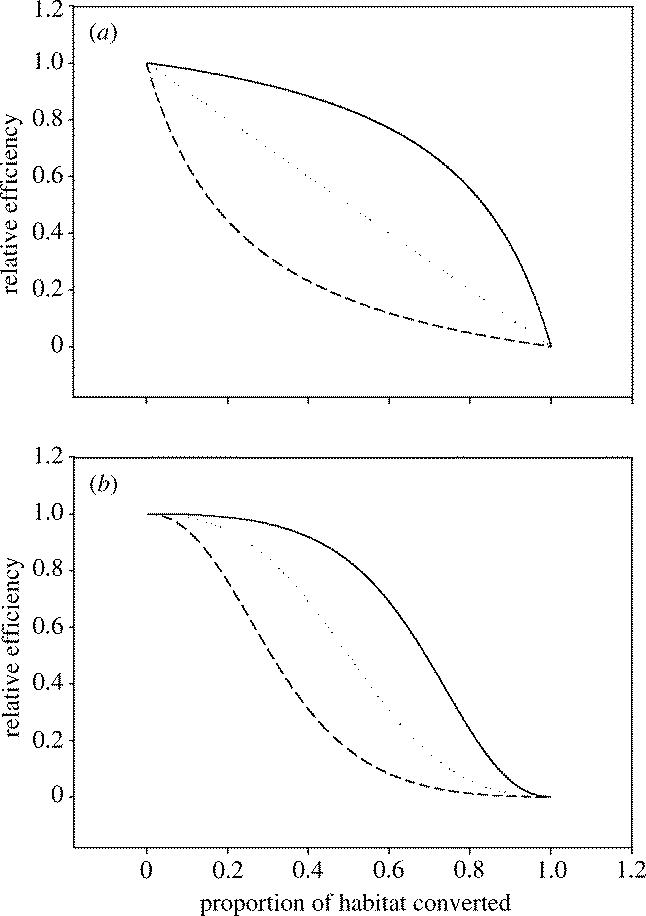
Figure 4.

The phenomenological relationship between the supply of ecosystem services and either the proportion of habitat converted or the proportion of the original host community that has been lost. In (a) we assume the τ-term in equation 12.2 equals unity, the curves are then drawn for ES50=0.8 (upper solid line); ES50=1 (middle dotted line); and ES50=5 (lowest dashed line). In (b) we have set τ=2 (corresponding to services from a higher trophic level), the same three values of ES50 are then used as in (a).
