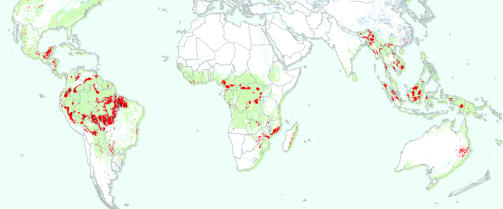
Figure 3.
Main tropical deforestation fronts in the 1980s and 1990s from Lambin et al. (2003) and Lepers et al. (in press). The map is based on the deforestation hotspots in the humid tropics of the TREES project (Achard et al. 1998), a time-series analysis of tree cover based on NOAA AVHRR 8 km resolution data (DeFries et al. 2000) and, for the Amazon basin, deforestation maps derived from time-series of Landsat TM data (Skole & Tucker 1993). The map indicates the number of times each 0.1° grid was identified as being affected by rapid deforestation by the different datasets (pink=1, red=2, dark red=3).

