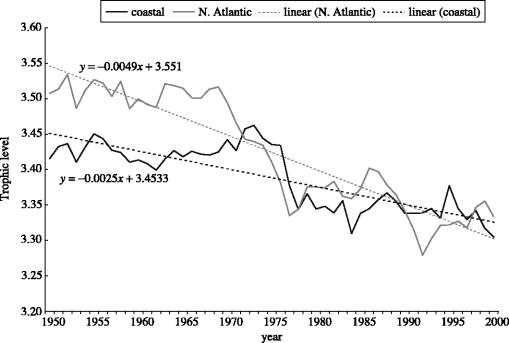
Figure 1.
Trends in mean trophic levels of fisheries landings, 1950–2000, based on aggregation of data from over 180 000 half-degree latitude/longitude cells (based on spatial disaggregation method of Watson et al. (2004)). Data for the North Atlantic is shown in grey and for Coastal waters is shown in black. Observed and fitted data are represented by solid and dashed lines respectively. Note: strong decline, particularly in the North Atlantic.

