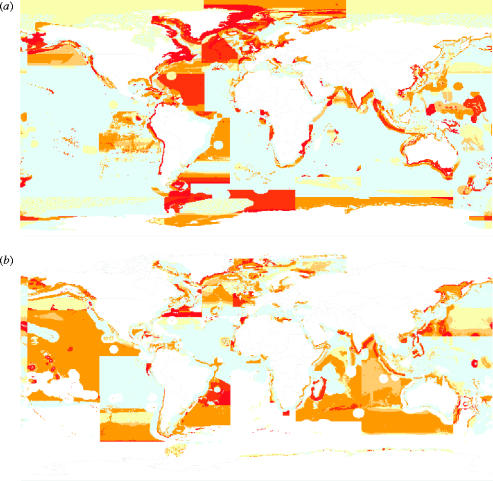
Figure 2.
Maps illustrating changes in MTI (i.e. mean trophic level of fisheries catches) from the early 1950s to the present. (a) Changes in grand mean TLs, corresponding to 2.0MTI (see text), based on FAO statistics disaggregated using method of Watson et al. (2004); (b) same data, but with trophic levels below 3.25 not included, and hence with maps representing changes in the values of 3.25MTI. Note: increase of the areas with negative changes, indicating that 3.25MTI is more sensitive than 2.0MTI. (In both panels, the straight borders between colours, and the areas of positive change, largely represent artefacts of the underlying FAO statistics; the white areas in panel (b) represent cells with catches of less than 1000 t.)

