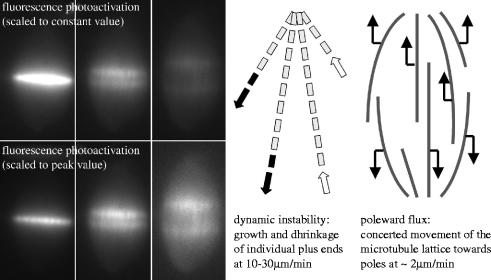
Figure 1.
Dynamic organization of Xenopus extract spindles. The left panels illustrate use of fluorescence photoactivation to probe microtubule dynamics. Tubulin labelled with caged fluorescein was incorporated into spindles, and a UV beam is used to uncage fluorescence in a bar near the chromosomes. The images show how this bar evolves over approximately 1.5 min intervals. The fluorescence decays rapidly, and remaining fluorescence splits into two bars that move towards the poles. The images are presented scaled to a constant value to emphasize turnover, and scaled to peak intensity to emphasize movement of remaining microtubules. This image is courtesy of Tarun Kapoor (Rockefeller University); for details see Sawin & Mitchison (1991). The models illustrate how we currently interpret these dynamics. Dynamic instability (centre) causes individual microtubules to turn over, while poleward flux (right) causes microtubules to slide steadily towards their minus ends.

