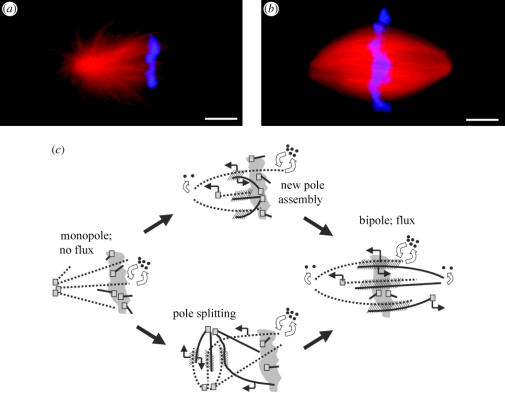
Figure 2.
Flux correlates with bipolarity. When sperm is added to mitotic extract, monopolar asters form initially (a). After approximately 30 min, these evolve into bipolar spindles (b). (Red is tubulin, blue DNA Bars, 10 μm). Fluorescence speckle microscopy of these structures allowed us to track the pathways that lead to bipolarization, and revealed that monopoles do not flux and that the onset of flux correlates with onset of bipolarity (Mitchison et al. 2004). (c) A model for bipolarization and flux is shown. Solid and dotted lines are microtubules of opposite polarity, squares are nucleation/capping complexes, open arrows indicate polymerization dynamics and closed arrows indicate sliding. Bipolarization occurs by a combination of new pole assembly near chromatin and splitting of the old pole. The monopolar structures do not flux, and flux starts as they become bipolar. This model suggests that interactions between overlapping, anti-parallel microtubules (shown hatched) are important for driving both bipolarization and flux.

