
Figure 4.
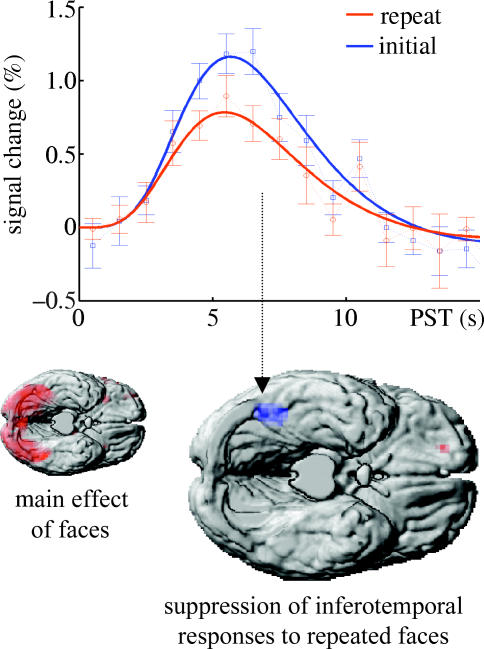
Repetition suppression as measured with fMRI in normal subjects. Top panel: estimated hemodynamic responses to the presentation of faces that were (red), and were not (blue), seen previously during the scanning session. These estimates were based on a linear convolution model of fMRI responses in the most significant voxel in the corresponding statistical parametric map. Lower panel: statistical parametric maps, overlaid on a cortical rendering of a single subject, showing areas that responded to all faces (left) and the region showing significant repetition suppression. For details, see Henson et al. (2000).