Figure 11.
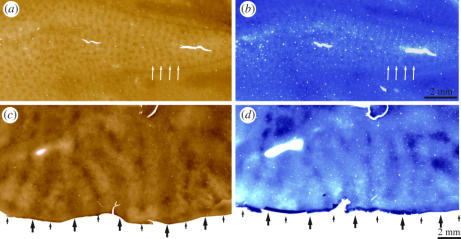
CO patches in V1 and CO stripes in V2 are revealed by many different labelling techniques. Here, they are shown by histochemical processing for another metabolic enzyme, β-nicotinamide adenine dinucleotide, reduced form (β-NADH). (a) CO patches in layers 2 and 3 of V1 form rows that follow the pattern of ocular dominance columns (arrows). (b) Adjacent section processed for β-NADH. The pattern of patches is identical (arrows). (c) CO-stained section from dorsal V2, with thick (large arrows) and thin (small arrows) stripes separated by pale stripes. (d) Adjacent section processed for β-NADH, showing the same pattern of stripes. Sections were processed for 2 h in a solution of 100 mg NADH (Sigma, grade III), 45 mg nitroblue tetrazolium and 12 ml DMSO in 100 ml of PBS (Horton unpublished work).

