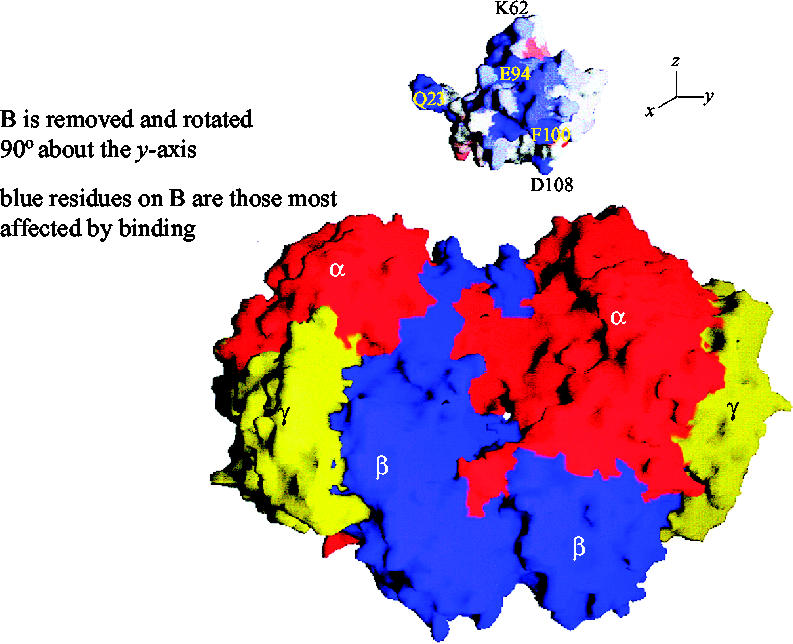
Figure 8.

Surface diagram model showing the docking of protein B into the canyon on the hydroxylase (Walters et al. 1999). The α subunits of the hydroxylase are shown in red, β in blue and γ in yellow. Protein B has been translated away from its proposed docking site on the surface of the hydroxylase. Furthermore, protein B has been rotated 90° clockwise about the y-axis to expose the residues most involved in binding. The residues coloured blue are the most affected by binding.
