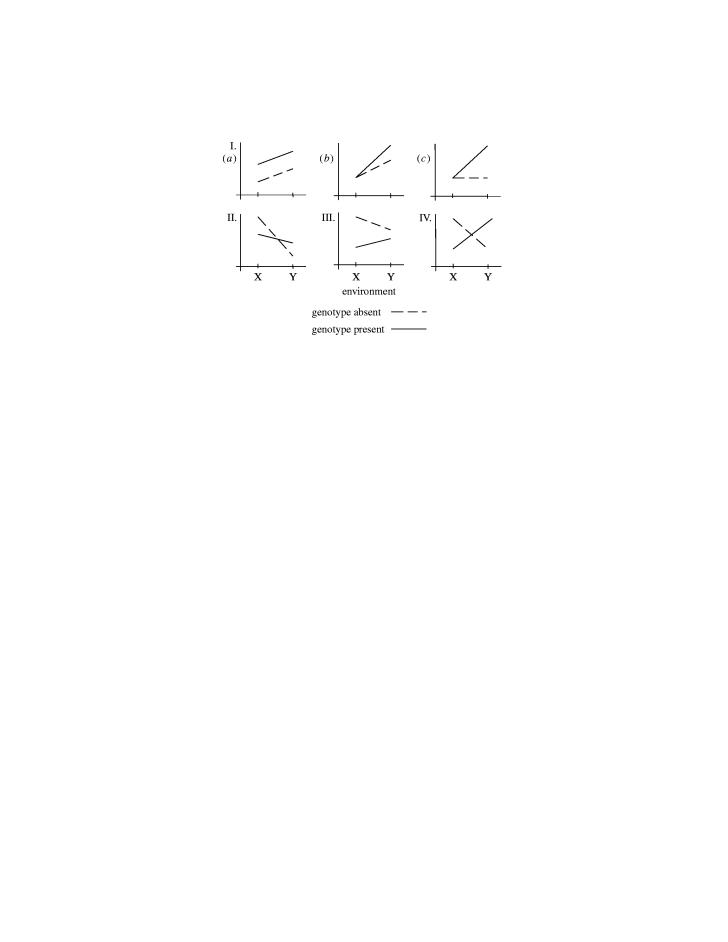
Figure 1.
Four qualitative patterns of gene–environment interaction described by (and numbered after) Haldane (1938). The y-axis represents a trait value (e.g. mean height, disease prevalence or expected survival); the x-axis represents two environmental conditions.

