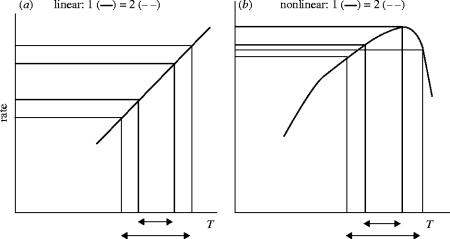
Figure 12.
Diagrams showing how the rates of a linear and nonlinear crop process may respond to differences in the amplitude (maximum minus minimum value) of temperature (T). Part (a) shows a linear process, where two amplitudes of temperature (defined by the arrows) lead to the same average rate of a process, i.e. the rate is independent of amplitude. Part (b) shows that the same amplitude as in (a) leads to two different rates for the process for a nonlinear process, making the rate dependent on amplitude.

