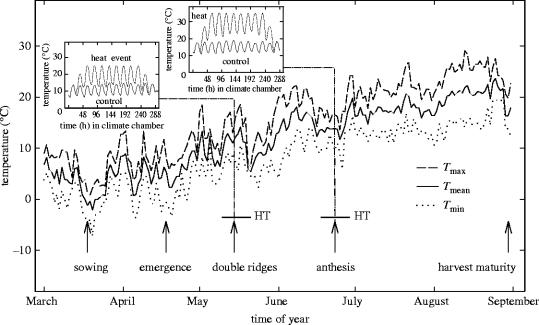
Figure 3.
Mean, minimum and maximum temperatures at the experimental site at for the heat episode experiment from March until September 1997. During heat events (HT), the plants were transferred to growth chambers and higher temperatures applied as indicated (Wollenweber et al. 2003).

