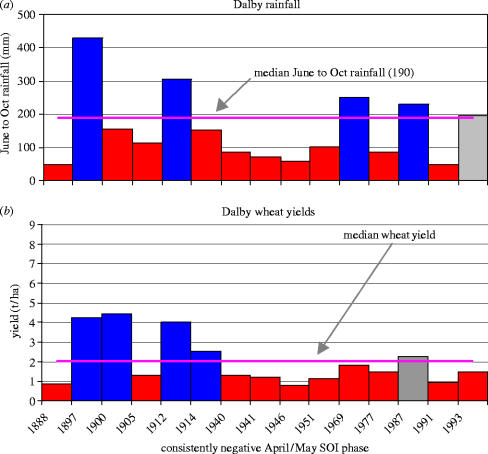
Figure 1.
Example of ‘hindcast’ output for a cropping location in Queensland, Australia together with modelled crop yield output (hindcasts) for the same period. (a) The output provided here shows the actual rainfall that has occurred in history for the June–October period following a ‘consistently negative SOI phase’ at the end of the immediately preceding May. (b) Cumulative probability distributions can be produced using data obtained from this type of information (after Hammer 2000).

