
Figure 6.
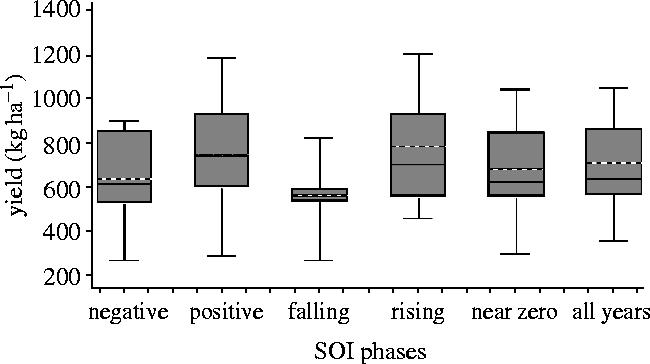
Distributions of simulated cotton yield for a crop grown in Tamil Nadu, India. The figure shows distributions of simulated cotton yield for an early sowing window at Avinashi for years associated with each of the five SOI phases in April/May together with the ‘all-years’ distribution (Selvaraju et al. 2004).