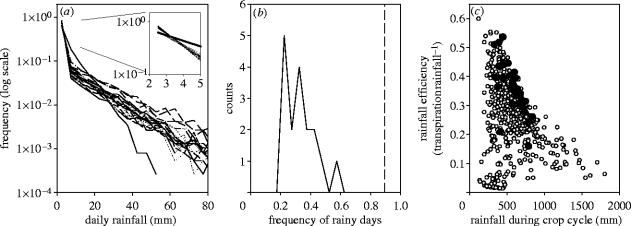
Figure 2.
(a) Daily rainfall distribution from June to September (JJAS) during 1950–1980 for the individual 17 stations of the GCM box of figure 1 (dotted lines) and for of the 17-station average (solid line). (b) Histogram of rain event frequency for the same 31 years. On the horizontal axis, 0 indicates that it never rains and 1 that it rains every day. The vertical line represents the value for the 17-station average. (c) Relationship between rainfall efficiency (transpiration rainfall−1) and total rainfall amount during crop cycle, simulated for 17 stations (dots) the 17-station average (circles).

