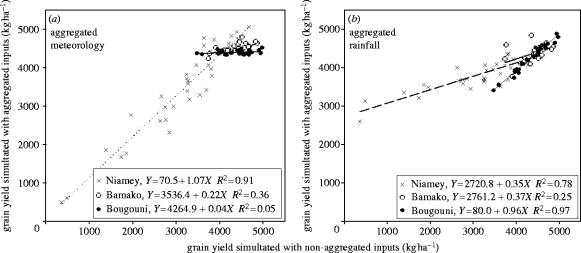
Figure 5.
Relationship between grain yield (kg ha−1) simulated for 1950–1980 for aggregated weather inputs (vertical axis, experimental run) and station specific inputs (horizontal axis, control run). (a) Aggregation of meteorological inputs (except rainfall) for GCM-type grid boxes for 31 years. (b) Aggregation of rainfall inputs. Data points and linear regressions for Niamey (circles), Bamako (triangles) and Bougouni (crosses).

