
Figure 2.
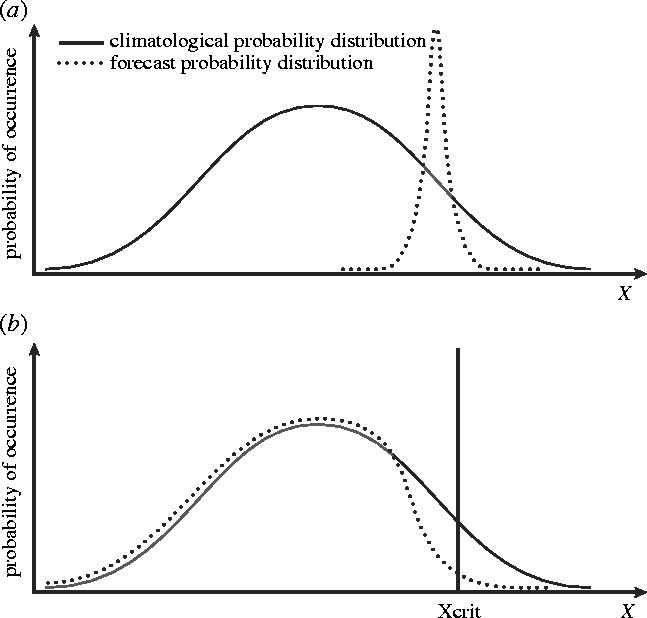
(a) The solid line is a schematic illustration of the climatological probability of some climatic variable, such as seasonal-mean surface temperature for some part of the tropics. The dashed line is a schematic illustration of a seasonal forecast probability distribution showing clear predictability. (b) as (a) but for a forecast probability distribution whose overall level of predictability is small. However, for certain applications which require knowledge of whether or not temperature exceeds some threshold, there may be significant predictability.