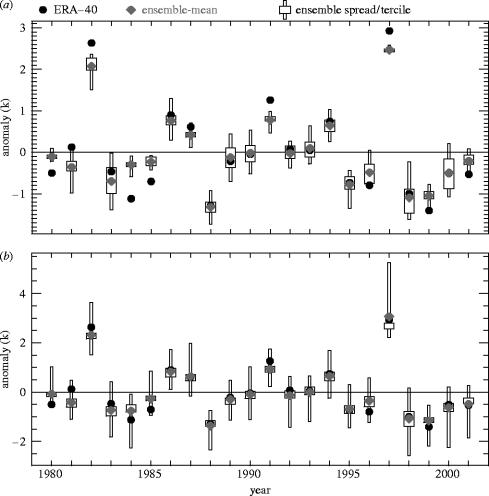
Figure 5.
(a) Seasonal forecast probability distributions of El Niño based on the ECMWF model within the DEMETER project; bar and whiskers give tercile distributions and grey diamonds give ensemble mean. The solid dot gives the observed value, which often lies outside the forecast. (b) As top but for the DEMETER multi-model ensemble. The validation now almost always lies within the ensemble. The probabilistic skill of the DEMETER multi-model ensemble is greater than for the single-model ensemble.

