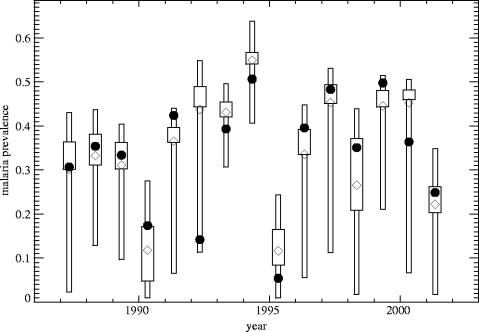
Figure 6.
Forecast probability distributions (bar and whiskers showing terciles) of malaria prevalence over southern Africa, based on the DEMETER multi-model ensemble system coupled to a malaria prediction model. The diamond denotes the ensemble-mean value, and the solid dot denotes malaria prevalence when the malaria model is forced with ERA-40 gridded analyses (so-called tier-2 validation; Morse et al. 2005).

