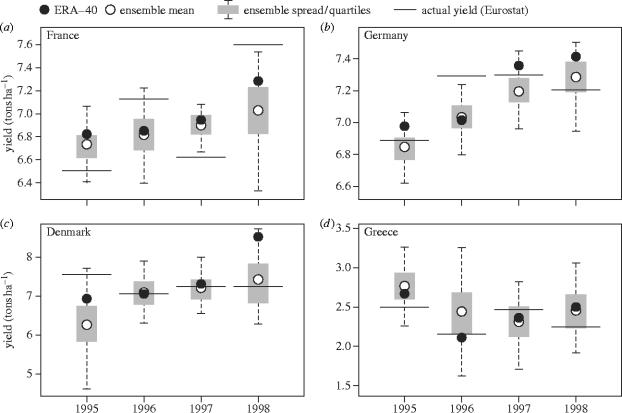
Figure 7.
Probability distributions of wheat yield for different countries (a) France, (b) Germany, (c) Denmark and (d) Greece in Europe, based on DEMETER multi-model re-forecasts (from Canteloube & Terres 2005). The open dot denotes the ensemble mean value, and the solid dot denotes crop yield when the crop model is forced with ERA-40 gridded analyses. The bars denote the Eurostat yield.

