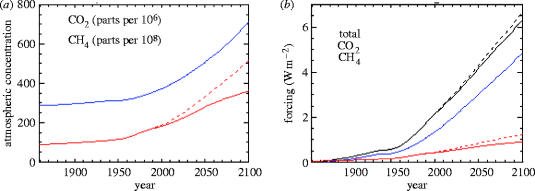
Figure 13.
Feedbacks between climate change and CH4 emissions from wetlands. (a) CH4 emissions excluding (solid red line) and including (dashed red line) the effects of climate change on wetland extent and temperature. CO2 concentrations (blue line) for comparison. (b) Global mean radiative forcing from CH4 (red lines), CO2 (blue line) and all species (black line), with effects of climate change on CH4 emissions excluded (solid lines) and included (dashed lines). (Gedney et al. 2004), British Crown Copyright.

