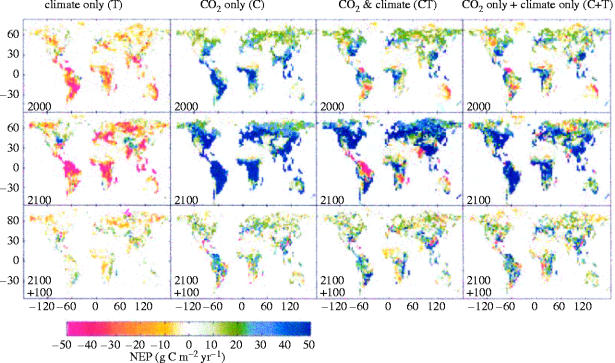
Figure 14.
NEP simulated under changes in CO2 and climate in various combinations. Column 1: NEP under climate change simulated by the HadCM2 GCM for the IS92a scenarios, with CO2 fixed at a pre-industrial concentration. Column 2: NEP under CO2 increasing according to IS92a, under pre-industrial climate. Column 3: NEP under climate change and CO2 imposed together. Column 4: linear combination of columns 1 and 2. Top row: present-day NEP. Middle row: state simulated for the end of the twenty-first century. Bottom row: state simulated for 100 years after a hypothetical stabilization at 2100. Individual maps are means of the output from six DGVMs. Cramer et al. (2001), copyright Blackwell.

