
Figure 17.
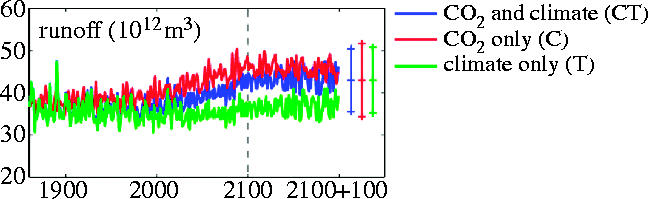
Time-series of global mean runoff simulated with six DGVMs, with climate change alone (green line), CO2 physiological forcing alone (red line) and both CO2 and climate change (blue line). Cramer et al. (2001), copyright Blackwell.
Official websites use .gov
A
.gov website belongs to an official
government organization in the United States.
Secure .gov websites use HTTPS
A lock (
) or https:// means you've safely
connected to the .gov website. Share sensitive
information only on official, secure websites.
Time-series of global mean runoff simulated with six DGVMs, with climate change alone (green line), CO2 physiological forcing alone (red line) and both CO2 and climate change (blue line). Cramer et al. (2001), copyright Blackwell.