
Figure 2.
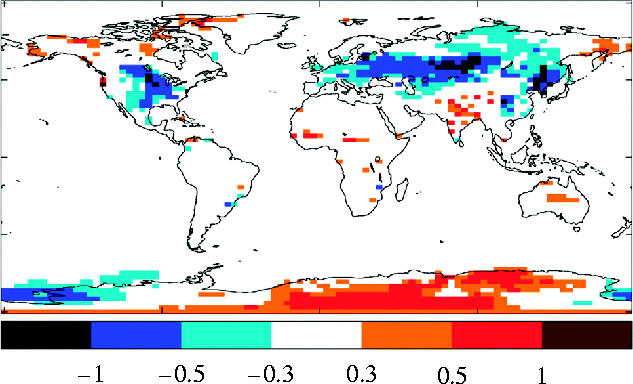
Effects of historical land cover change on near-surface temperature (K) simulated with the HadAM3 GCM. Difference in temperature (K) between simulations with current vegetation and potential natural vegetation (Betts 2001).
Official websites use .gov
A
.gov website belongs to an official
government organization in the United States.
Secure .gov websites use HTTPS
A lock (
) or https:// means you've safely
connected to the .gov website. Share sensitive
information only on official, secure websites.
Effects of historical land cover change on near-surface temperature (K) simulated with the HadAM3 GCM. Difference in temperature (K) between simulations with current vegetation and potential natural vegetation (Betts 2001).