
Figure 1.
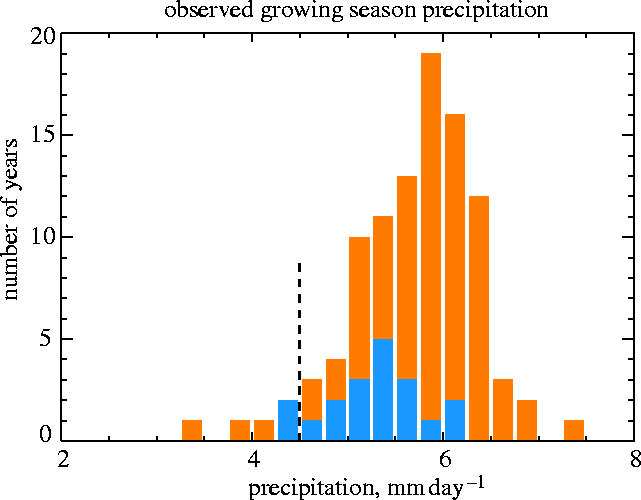
Mean rainfall (mm day−1) during the growing season, as derived from the Climate Research Unit (CRU; University of East Anglia, Norwich, UK) gridded climatology and for the region of latitude 3.75–21.25°N, and longitude 16.875°W–35.625°E. The growing season is defined as the months of July, August and September. The histogram heights given by the orange bars are for the period 1900–1998. The subset of these, given in blue, is the years 1971–1989, which represent an extended period of drought. The vertical dashed line at 4.5 mm day−1 marks the difference between the two extremely dry years in the drought period (years 1983 and 1984), which attracted international action.